Generating A Sine Wave Pattern Over Time
The CAN controller mockup generates a sine wave onto its CAN interface. This is how it’s done.
Base Operation
from math import pi, sin

def mysin(x, amplitude, hz, phase_shift, vertical_shift):
    return amplitude * sin(hz*(x+phase_shift)) + vertical_shift

mysin(2*pi, hz=10, amplitude=5, phase_shift=pi/2, vertical_shift=37)
37.0
Fancy Plotting, And Heavy Dependencies
import matplotlib.pyplot as plt
import numpy
xaxis = numpy.linspace(0, 2*pi)
xaxis
array([0.        , 0.12822827, 0.25645654, 0.38468481, 0.51291309,
       0.64114136, 0.76936963, 0.8975979 , 1.02582617, 1.15405444,
       1.28228272, 1.41051099, 1.53873926, 1.66696753, 1.7951958 ,
       1.92342407, 2.05165235, 2.17988062, 2.30810889, 2.43633716,
       2.56456543, 2.6927937 , 2.82102197, 2.94925025, 3.07747852,
       3.20570679, 3.33393506, 3.46216333, 3.5903916 , 3.71861988,
       3.84684815, 3.97507642, 4.10330469, 4.23153296, 4.35976123,
       4.48798951, 4.61621778, 4.74444605, 4.87267432, 5.00090259,
       5.12913086, 5.25735913, 5.38558741, 5.51381568, 5.64204395,
       5.77027222, 5.89850049, 6.02672876, 6.15495704, 6.28318531])
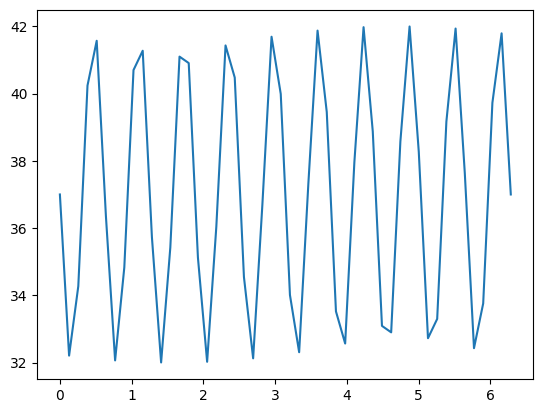
plt.plot(xaxis, [mysin(x, hz=10, amplitude=5, phase_shift=pi/2, vertical_shift=37) for x in xaxis])
[<matplotlib.lines.Line2D at 0x7759e93fe2d0>]